Market Outlook
August 23, 2016
Market Cues
Domestic Indices
Chg (%)
(Pts)
(Close)
Indian markets are likely to open on a flat note tracking SGX Nifty.
BSE Sensex
(0.3)
(91)
27,986
Nifty
(0.4)
(38)
8,629
US markets showed a lack of direction and closed flat on Monday. This lack of
direction was due to investors confusion over the possible direction of interest rates.
Mid Cap
(0.4)
(54)
12,981
Oil stocks closed significantly lower due to weakness in crude oil price acted as a
Small Cap
(0.1)
(17)
12,442
drag on the indices.
Bankex
(0.5)
(120)
22,176
European markets drifted lower as investors awaited decisions by central bankers by
the end of the week. The FTSE was dragged significantly lower due to weakness in
Global Indices
Chg (%)
(Pts)
(Close)
mining and oil stocks. This was due to overall weakness in commodity prices in
Dow Jones
(0.1)
(23)
18,529
metals and oil.
Nasdaq
0
6
5,244
Indian markets continued their losses from Friday to close lower on Monday. Fears
FTSE
(0.4)
(30)
6,828
over a delay in reduction of interest rates and cautious global sentiment over the last
Nikkei
0.3
52
16,598
session were the primary sources of investor bearishness. IT stocks were the major
Hang Seng
0.3
61
22,998
losers along with PSU banks and the auto sector while FMCG stocks closed positive.
Shanghai Com
(0.7)
(23)
3,085
Result Preview
Result Preview: Aurobindo Pharma
Advances / Declines
BSE
NSE
Detailed analysis on Pg2
Advances
1,268
690
Investor’s Ready Reckoner
Declines
1,463
892
Unchanged
204
105
Key Domestic & Global Indicators
Stock Watch: Latest investment recommendations on 150+ stocks
Volumes (` Cr)
Refer Pg5 onwards
BSE
3,056
Top Picks
NSE
18,165
CMP
Target
Upside
Company
Sector
Rating
(`)
(`)
(%)
Amara Raja
Auto/Auto Ancillary
Buy
895
1,076
20.3
Net Inflows (` Cr)
Net
Mtd
Ytd
HCL Tech
IT
Buy
772
1,000
29.5
FII
(301)
7,317
38,397
HDFC Bank
Financials
Accumulate
1,249
1,350
8.1
MFs
51
(4,811)
8,599
Bharat Electronics
Capital Goods
Buy
1,222
1,414
15.7
Navkar Corporation Others
Buy
201
265
32.0
Top Gainers
Price (`)
Chg (%)
More Top Picks on P3
Oberoirlty
314
5.2
Key Upcoming Events
Biocon
882
4.3
Previous
Consensus
Date
Region
Event Description
Reading
Expectations
Igl
729
4.3
Aug 23
US
New Home sales
592.0
579.0
Escorts
316
3.7
Aug 23 Germany
PMI Services
54.4
--
Gmdcltd
90
3.6
Aug 24 Germany
PMI Manufacturing
53.8
--
Aug 26
US
GDP QoQ (Annualised)
1.2
1.1
Top Losers
Price (`)
Chg (%)
Aug 26
UK GDP YoY
2.2
--
6.(
Welcorp
84
(5.2)
More Events on Pg4
Suntv
459
(4.9)
Bharatfin
749
(4.8)
Indhotel
130
(3.9)
Vrllog
296
(3.7)
As on August 22, 2016
Market Outlook
August 23, 2016
Result Preview
Aurobindo Pharma (CMP: `750 / TP: `877 /Upside: 16.9%)
For 1QFY2017, sales are expected to come in at `3,900cr V/s `3,320cr in
1QFY2016, a yoy growth of 17.5%, mainly driven by exports. On the operating
profit front, the EBITDA margins came in at 22.8% expected V/s 21.8% in
1QFY2016, mainly driven by gross margin expansion (57.7% in 1QFY2017 V/s
54.6% in 1QFY2016). Thus, the Adj. net profit came in at `576cr V/s `451cr in
1QFY2016.We maintain our buy rating.
Y/E
Sales OPM
PAT
EPS ROE P/E P/BV EV/EBITDA EV/Sales
Mar
(` cr)
(%)
(` cr)
(`)
(%)
(x)
(x)
(x)
(x)
FY2017E
15,720
23.7
2,418
41.4
29.6
18.1
4.7
12.7
3.0
FY2018E
18,078
23.7
2,763
47.3
26.1
15.9
3.7
11.0
2.6
Economic and Political News
Urjit Patel appointed as the new RBI governor
Central Govt. announces plans to provide `90,000 cr to Self Help Groups
over the next two years
Union shipping minister asks major ports to develop inland water ways.
Corporate News
Escorts to focus on core businesses after divesting auto parts business
SpiceJet adds new flights connecting the North-East
Shipping Corporation to spend `1700 cr on capex in FY17
Quarterly Bloomberg Brokers Consensus Estimate
Tata Power Ltd Consol - Aug 23, 2016
Particulars (` cr)
1QFY17E
1QFY16
y-o-y (%)
4QFY16 q-o-q (%)
Net sales
9,275
9,235
0.4
9,375
(1.1)
EBITDA
1,995
2,181
(8.5)
1,913
4.3
EBITDA margin (%)
21.5
23.6
20.4
Net profit
341
241
41.3
360
(5.3)
Market Outlook
August 23, 2016
Top Picks ★★★★★
Large Cap
Market Cap
CMP
Target
Upside
Company
Rationale
(` Cr)
(`)
(`)
(%)
To outpace battery industry growth due to better technological
Amara Raja Batteries
15,281
895
1,076
20.3
products leading to market share gains in both the automotive
OEM and replacement segments.
Uptick in defense capex by government, coupled with BELs
Bharat Electronics
29,338
1,222
1,414
15.7
strong market positioning, indicate good times ahead for BEL.
HCL Tech
1,08,946
772
1,000
29.5
Stock is trading at attractive valuations & factors all bad news.
Strong visibility for a robust 20% earnings trajectory, coupled
HDFC Bank
3,16,176
1,249
1,350
8.1
with high quality of earnings on account of high quality retail
business and strategic focus on highly rated corporates.
Back on the growth trend, expect a long term growth of 14% to
Infosys
2,33,232
1,015
1,370
34.9
be a US$20bn in FY2020.
Strong market positioning within the domestic AC markets to
Voltas
12,345
373
407
9.1
continue, EMP business set to revive
Source: Company, Angel Research
Mid Cap
Market Cap
CMP
Target
Upside
Company
Rationale
(` Cr)
(`)
(`)
(%)
Among the top 4 players in the consumer durables segment.
Bajaj Electricals
2,642
262
277
5.9
Improved profitability backed by turn around in E&P segment.
Strong order book lends earnings visibility.
Favourable outlook for the AC industry to augur well for
Cooling products business which is out pacing the market
Blue Star
4,681
491
527
7.4
growth. EMPPAC division's profitability to improve once
operating environment turns around.
Strong loan growth backed by diversified loan portfolio and
Equitas Holdings
6,206
185
235
27.0
adequate CAR. ROE & ROA likely to remain decent as risk of
dilution remains low. Attractive valuations considering growth.
Expectations of above average monsoon augurs well for
Goodyear India
1,281
556
631
13.6
Goodyear India as it derives ~50% of its turnover from farm
tyre segment.
Commencement of new projects, downtrend in the interest rate
IL&FS Transport
2,232
68
93
37.1
cycle, to lead to stock re-rating
Economic recovery to have favourable impact on advertising &
Jagran Prakashan
6,004
184
205
11.6
circulation revenue growth. Further, the acquisition of a radio business
(Radio City) would also boost the company`s revenue growth.
Speedier execution and speedier sales, strong revenue visibility
Mahindra Lifespace
1,774
432
554
28.1
in short-to-long run, attractive valuations
Massive capacity expansion along with rail advantage at ICD as
Navkar Corporation
2,864
201
265
32.0
well CFS augurs well for the company
Earnings boost on back of stable material prices and favourable
Radico Khaitan
1,310
98
125
27.0
pricing environment. Valuation discount to peers provides
additional comfort
Strong brands and distribution network would boost growth
Siyaram Silk Mills
1,120
1,195
1,347
12.8
going ahead. Stock currently trades at an inexpensive valuation.
Market leadership in Hindi news genre and no. 2 viewership
TV Today Network
1,776
298
363
22.0
ranking in English news genre, exit from the radio business, and
anticipated growth in ad spends by corporates to benefit the stock.
Source: Company, Angel Research
Market Outlook
August 23, 2016
Key Upcoming Events
Result Calendar
Date
Company
August 23, 2016
Tata Power Co.
August 25, 2016
Jyoti Structures
August 26, 2016
Tata Motors, Abbot India
Source: Bloomberg, Angel Research
Global economic events release calendar
Bloomberg Data
Date
Time
Country Event Description
Unit
Period
Last Reported Estimated
Aug 23, 2016
2:30 PM Euro Zone
Euro-Zone CPI (YoY)
% Jul F
0.20
0.20
7:30 PM
US
New home sales
Thousands
Jul
592.00
577.00
11:30 AM Germany
GDP nsa (YoY)
% Change 2Q F
3.10
1:00 PM Germany
PMI Services
Value Aug P
54.40
Aug 24, 2016
1:00 PM Germany
PMI Manufacturing
Value Aug P
53.80
7:30 PM
US
Existing home sales
Million
Jul
5.57
5.55
Aug 26, 2016
6:00 PM
US
GDP Qoq (Annualised)
% Change 2Q S
1.20
1.10
2:00 PM
UK
GDP (YoY)
% Change 2Q P
2.20
Aug 30, 2016
7:30 PM
US
Consumer Confidence S.A./ 1985=100 Aug
97.30
97.00
Aug 31, 2016
1:25 PM Germany
Unemployment change (000's)
Thousands Aug
(7.00)
Sep 01, 2016
2:00 PM
UK
PMI Manufacturing
Value
Aug
48.20
6:30 AM
China
PMI Manufacturing
Value
Aug
49.90
Source: Bloomberg, Angel Research
Market Outlook
August 23, 2016
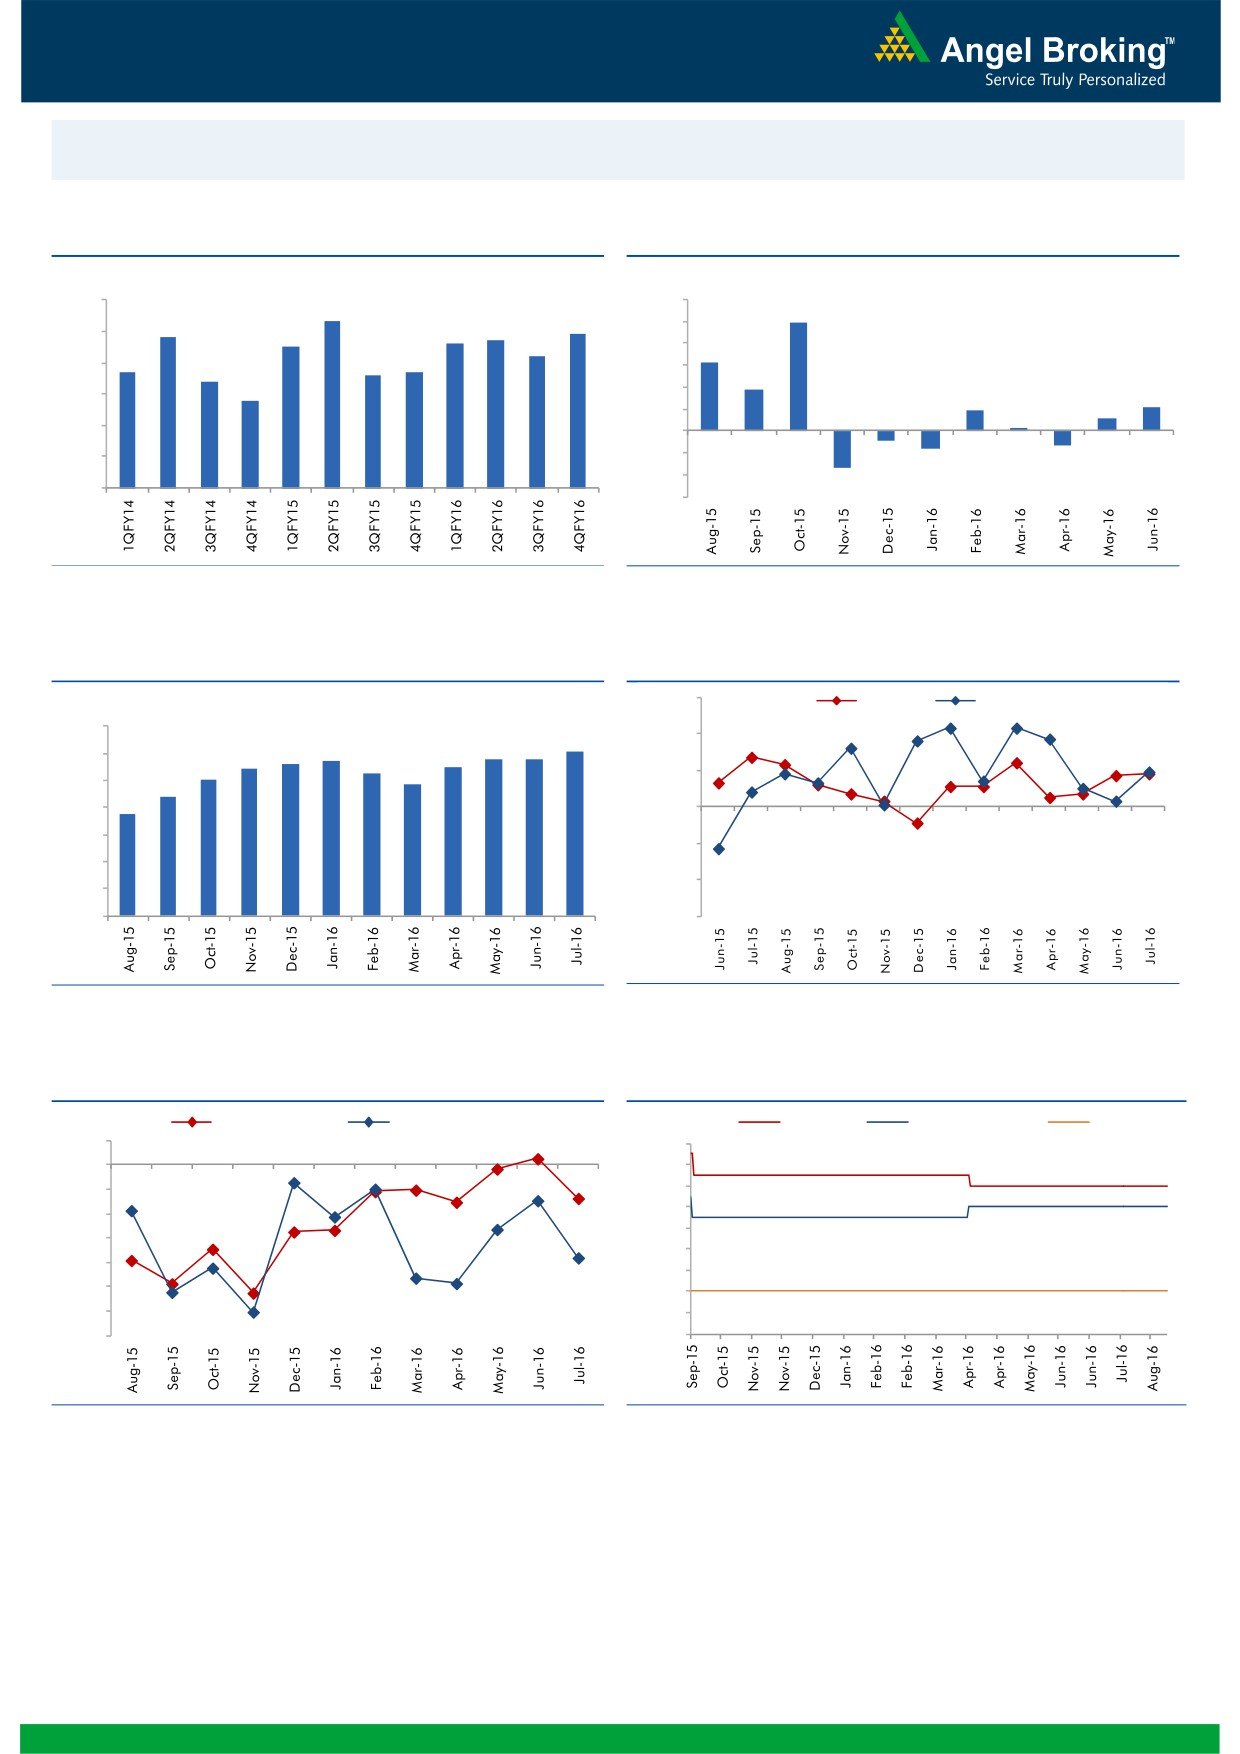
Macro watch
Exhibit 1: Quarterly GDP trends
Exhibit 2: IIP trends
(%)
(%)
9.0
8.3
12.0
9.9
7.8
7.7
7.9
10.0
8.0
7.5
7.6
7.2
8.0
6.3
6.7
6.6
6.7
7.0
6.4
6.0
3.7
5.8
4.0
6.0
1.9
2.1
1.1
2.0
0.3
5.0
-
4.0
(2.0)
(0.9)
(1.3)
(1.6)
(4.0)
3.0
(3.4)
(6.0)
Source: CSO, Angel Research
Source: MOSPI, Angel Research
Exhibit 3: Monthly CPI inflation trends
Exhibit 4: Manufacturing and services PMI
56.0
Mfg. PMI
Services PMI
(%)
7.0
6.1
54.0
5.6
5.7
5.8
5.8
5.4
5.5
6.0
5.3
5.0
4.8
52.0
5.0
4.4
3.7
4.0
50.0
3.0
48.0
2.0
46.0
1.0
-
44.0
Source: MOSPI, Angel Research
Source: Market, Angel Research; Note: Level above 50 indicates expansion
Exhibit 5: Exports and imports growth trends
Exhibit 6: Key policy rates
(%)
Exports yoy growth
Imports yoy growth
(%)
Repo rate
Reverse Repo rate
CRR
5.0
7.50
0.0
7.00
(5.0)
6.50
6.00
(10.0)
5.50
(15.0)
5.00
(20.0)
4.50
(25.0)
4.00
(30.0)
3.50
(35.0)
3.00
Source: Bloomberg, Angel Research
Source: RBI, Angel Research
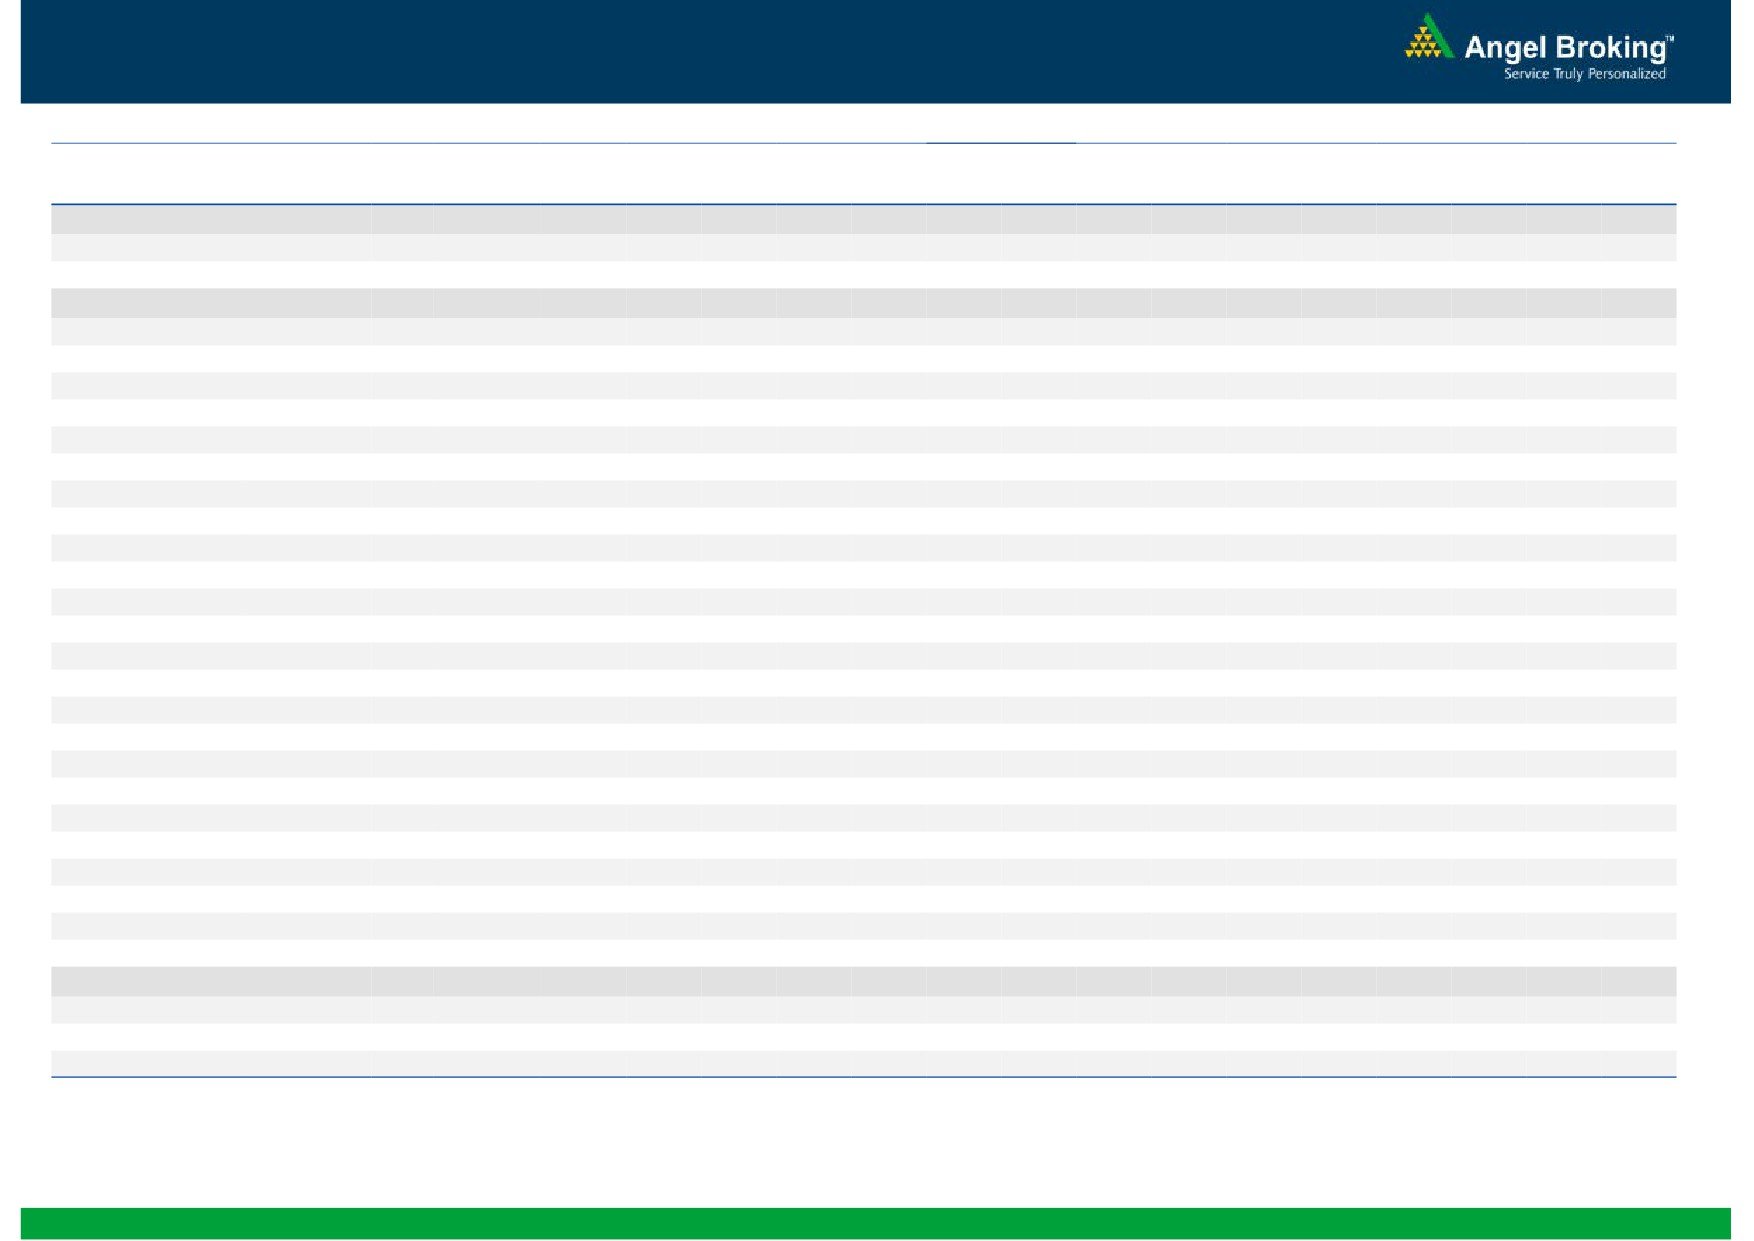
Stock Watch
August 23, 2016
Company Name
Reco
CMP
Target
Mkt Cap
Sales ( Čcr )
OPM(%)
EPS (Č)
PER(x)
P/BV(x)
RoE(%)
EV/Sales(x)
(Č)
Price ( Č)
( Č cr )
FY17E FY18E
FY17E
FY18E
FY17E
FY18E
FY17E
FY18E
FY17E
FY18E
FY17E
FY18E
FY17E
FY18E
Agri / Agri Chemical
Rallis
Neutral
217
-
4,211
1,937
2,164
13.3
14.3
9.0
11.0
24.1
19.7
4.2
3.7
18.4
19.8
2.3
2.0
United Phosphorus
Accumulate
652
684
27,958
15,176
17,604
18.5
18.5
37.4
44.6
17.4
14.6
3.4
2.8
21.4
21.2
1.9
1.6
Auto & Auto Ancillary
Ashok Leyland
Buy
87
111
24,816
22,407
26,022
10.6
10.6
5.2
6.4
16.7
13.6
3.8
3.2
23.6
24.7
1.2
1.0
Bajaj Auto
Neutral
2,931
-
84,826
25,093
27,891
19.5
19.2
143.9
162.5
20.4
18.0
5.7
4.9
30.3
29.4
3.1
2.7
Bharat Forge
Neutral
834
-
19,406
7,726
8,713
20.5
21.2
35.3
42.7
23.6
19.5
4.4
3.9
18.9
20.1
2.6
2.3
Eicher Motors
Neutral
21,795
-
59,198
16,583
20,447
17.5
18.0
598.0
745.2
36.5
29.3
12.5
9.5
41.2
38.3
3.5
2.7
Gabriel India
Neutral
115
-
1,653
1,544
1,715
9.0
9.3
5.4
6.3
21.3
18.3
4.0
3.6
18.9
19.5
1.0
0.9
Hero Motocorp
Neutral
3,338
-
66,655
31,253
35,198
15.3
15.0
172.3
192.1
19.4
17.4
7.1
6.1
38.9
37.0
2.0
1.8
Jamna Auto Industries Neutral
219
-
1,745
1,486
1,620
9.8
9.9
15.0
17.2
14.6
12.7
3.2
2.7
21.8
21.3
1.3
1.2
L G Balakrishnan & Bros Neutral
459
-
721
1,302
1,432
11.6
11.9
43.7
53.0
10.5
8.7
1.5
1.4
13.8
14.2
0.6
0.6
Mahindra and Mahindra Neutral
1,443
-
89,648
46,534
53,077
11.6
11.7
67.3
78.1
21.4
18.5
3.5
3.0
15.4
15.8
1.9
1.7
Maruti
Neutral
4,838
-
146,149
69,186
82,217
14.7
14.4
198.5
241.4
24.4
20.0
4.7
3.8
20.2
20.0
1.8
1.5
Minda Industries
Neutral
1,276
-
2,024
2,728
3,042
9.0
9.1
68.2
86.2
18.7
14.8
4.2
3.4
23.8
24.3
0.7
0.6
Motherson Sumi
Neutral
327
-
43,267
45,896
53,687
7.8
8.3
13.0
16.1
25.1
20.3
8.1
6.5
34.7
35.4
1.0
0.9
Rane Brake Lining
Neutral
667
-
528
511
562
11.3
11.5
28.1
30.9
23.7
21.6
3.6
3.3
15.3
15.0
1.1
1.1
Setco Automotive
Neutral
46
-
609
741
837
13.0
13.0
15.2
17.0
3.0
2.7
0.5
0.5
15.8
16.3
1.2
1.1
Tata Motors
Neutral
504
-
145,443
300,209
338,549
8.9
8.4
42.7
54.3
11.8
9.3
1.9
1.6
15.6
17.2
0.6
0.5
TVS Motor
Accumulate
306
330
14,552
13,390
15,948
6.9
7.1
12.8
16.5
24.0
18.5
6.0
4.7
26.3
27.2
1.1
0.9
Amara Raja Batteries
Buy
895
1,076
15,281
5,717
6,733
18.7
18.9
38.4
48.9
23.3
18.3
5.8
4.7
25.3
24.8
2.6
2.1
Exide Industries
Neutral
175
-
14,901
7,439
8,307
15.0
15.0
8.1
9.3
21.6
18.9
3.0
2.7
14.3
16.7
1.6
1.5
Apollo Tyres
Neutral
171
-
8,692
12,877
14,504
14.3
13.9
21.4
23.0
8.0
7.4
1.2
1.1
16.4
15.2
0.9
0.8
Ceat
Buy
844
1,119
3,414
7,524
8,624
13.0
12.7
131.1
144.3
6.4
5.9
1.2
1.0
19.8
18.6
0.5
0.5
JK Tyres
Neutral
111
-
2,506
7,455
8,056
15.0
15.0
21.8
24.5
5.1
4.5
1.1
0.9
22.8
21.3
0.5
0.4
Swaraj Engines
Neutral
1,150
-
1,428
660
810
15.2
16.4
54.5
72.8
21.1
15.8
6.6
6.0
31.5
39.2
2.0
1.6
Subros
Neutral
102
-
613
1,488
1,681
11.7
11.9
6.4
7.2
16.0
14.3
1.7
1.5
10.8
11.4
0.7
0.6
Indag Rubber
Neutral
173
-
455
286
326
19.8
16.8
11.7
13.3
14.8
13.0
2.5
2.3
17.8
17.1
1.2
1.1
Capital Goods
ACE
Neutral
43
-
424
709
814
4.1
4.6
1.4
2.1
30.6
20.4
1.3
1.2
4.4
6.0
0.8
0.7
BEML
Accumulate
1,022
1,157
4,255
3,451
4,055
6.3
9.2
31.4
57.9
32.5
17.7
2.0
1.8
6.3
10.9
1.4
1.1
Bharat Electronics
Buy
1,222
1,414
29,338
8,137
9,169
16.8
17.2
58.7
62.5
20.8
19.6
3.2
2.9
44.6
46.3
2.6
2.3
Stock Watch
August 23, 2016
Company Name
Reco
CMP
Target
Mkt Cap
Sales ( Čcr )
OPM(%)
EPS (Č)
PER(x)
P/BV(x)
RoE(%)
EV/Sales(x)
(Č)
Price ( Č)
( Č cr )
FY17E
FY18E
FY17E
FY18E
FY17E
FY18E
FY17E
FY18E
FY17E
FY18E
FY17E
FY18E
FY17E
FY18E
Capital Goods
Voltas
Accumulate
373
407
12,345
6,511
7,514
7.9
8.7
12.9
16.3
28.9
22.9
5.2
4.6
16.7
18.5
1.6
1.4
BGR Energy
Neutral
115
-
828
16,567
33,848
6.0
5.6
7.8
5.9
14.7
19.5
0.8
0.8
4.7
4.2
0.2
0.1
BHEL
Neutral
144
-
35,135
28,797
34,742
-
2.8
2.3
6.9
62.4
20.8
1.1
1.0
1.3
4.8
0.8
0.6
Blue Star
Accumulate
491
527
4,681
4,351
5,024
6.4
7.1
17.2
20.6
28.6
23.8
18.6
15.5
23.1
24.1
1.1
1.0
Crompton Greaves
Neutral
87
-
5,462
5,777
6,120
5.9
7.0
3.3
4.5
26.4
19.4
1.2
1.1
4.4
5.9
0.9
0.8
Greaves Cotton
Neutral
137
-
3,333
1,755
1,881
16.8
16.9
7.8
8.5
17.5
16.1
3.5
3.3
20.6
20.9
1.6
1.5
Inox Wind
Buy
194
286
4,301
5,605
6,267
15.7
16.4
24.8
30.0
7.8
6.5
2.2
1.6
25.9
24.4
0.8
0.7
KEC International
Neutral
137
-
3,512
9,294
10,186
7.9
8.1
9.9
11.9
13.8
11.5
2.0
1.8
15.6
16.3
0.6
0.6
Thermax
Neutral
840
-
10,007
5,421
5,940
7.3
7.3
25.7
30.2
32.7
27.8
4.0
3.6
12.2
13.1
1.8
1.6
VATech Wabag
Buy
571
681
3,113
3,136
3,845
8.9
9.1
26.0
35.9
22.0
15.9
2.8
2.3
13.4
15.9
0.9
0.7
Cement
ACC
Neutral
1,659
-
31,157
11,225
13,172
13.2
16.9
44.5
75.5
37.3
22.0
3.5
3.3
11.2
14.2
2.8
2.4
Ambuja Cements
Neutral
271
-
53,722
9,350
10,979
18.2
22.5
5.8
9.5
46.7
28.5
3.9
3.5
10.2
12.5
4.5
3.9
India Cements
Neutral
129
-
3,973
4,364
4,997
18.5
19.2
7.9
11.3
16.4
11.5
1.2
1.1
8.0
8.5
1.6
1.4
JK Cement
Neutral
793
-
5,542
4,398
5,173
15.5
17.5
31.2
55.5
25.4
14.3
3.1
2.6
12.0
15.5
1.8
1.5
J K Lakshmi Cement
Neutral
432
-
5,085
2,913
3,412
14.5
19.5
7.5
22.5
57.6
19.2
3.5
3.0
12.5
18.0
2.4
2.0
Orient Cement
Neutral
170
-
3,492
2,114
2,558
18.5
20.5
8.1
11.3
21.0
15.1
3.1
2.6
9.0
14.0
2.2
1.8
UltraTech Cement
Neutral
3,866
-
106,092
25,768
30,385
21.0
23.5
111.0
160.0
34.8
24.2
4.4
3.9
13.5
15.8
4.2
3.5
Construction
ITNL
Buy
68
93
2,232
8,946
10,017
31.0
31.6
8.1
9.1
8.4
7.5
0.3
0.3
4.2
5.0
3.6
3.3
KNR Constructions
Neutral
698
-
1,964
1,210
1,595
15.4
16.0
33.9
52.1
20.6
13.4
3.2
2.7
13.6
18.0
1.7
1.2
Larsen & Toubro
Accumulate
1,492
1,700
139,065
67,665
77,249
10.7
11.5
57.3
71.2
26.0
21.0
2.4
2.2
12.6
14.3
2.2
1.9
Gujarat Pipavav Port
Neutral
173
-
8,344
705
788
52.2
51.7
5.0
5.6
34.5
30.8
3.4
3.1
11.2
11.2
11.6
9.9
MBL Infrastructures
Buy
117
285
485
2,797
3,405
14.7
15.4
21.0
34.8
5.6
3.4
0.6
0.5
11.0
16.2
0.8
0.8
Nagarjuna Const.
Neutral
86
-
4,784
8,842
9,775
9.1
8.8
5.3
6.4
16.2
13.5
1.3
1.2
8.2
9.1
0.7
0.6
PNC Infratech
Buy
118
647
3,019
2,350
2,904
13.4
13.7
48.0
42.0
2.5
2.8
0.5
0.4
16.8
13.2
1.4
1.1
Simplex Infra
Neutral
295
-
1,460
6,829
7,954
10.5
10.5
31.4
37.4
9.4
7.9
1.0
0.9
9.9
13.4
0.6
0.5
Power Mech Projects
Neutral
489
-
720
1,801
2,219
12.7
14.6
72.1
113.9
6.8
4.3
1.3
1.1
16.8
11.9
0.4
0.3
Sadbhav Engineering
Neutral
287
-
4,922
3,598
4,140
10.3
10.6
9.0
11.9
31.9
24.1
3.3
2.9
9.9
11.9
1.7
1.4
NBCC
Neutral
243
-
14,571
7,428
9,549
7.9
8.6
8.2
11.0
29.6
22.1
1.5
1.2
28.2
28.7
1.7
1.2
MEP Infra
Neutral
43
-
693
1,877
1,943
30.6
29.8
3.0
4.2
14.2
10.1
6.9
4.6
0.6
0.6
1.7
1.6
Stock Watch
August 23, 2016
Company Name
Reco
CMP
Target
Mkt Cap
Sales ( Čcr )
OPM(%)
EPS (Č)
PER(x)
P/BV(x)
RoE(%)
EV/Sales(x)
(Č)
Price ( Č)
( Č cr )
FY17E
FY18E
FY17E
FY18E
FY17E
FY18E
FY17E
FY18E
FY17E
FY18E
FY17E
FY18E
FY17E
FY18E
Construction
SIPL
Neutral
96
-
3,381
1,036
1,252
65.5
66.2
(8.4)
(5.6)
3.6
4.1
(22.8)
(15.9)
11.5
9.6
Engineers India
Neutral
233
-
7,835
1,725
1,935
16.0
19.1
11.4
13.9
20.4
16.7
2.8
2.7
13.4
15.3
3.4
3.0
Financials
Axis Bank
Neutral
580
-
138,468
58,081
66,459
3.5
3.5
32.4
44.6
17.9
13.0
2.4
2.1
13.6
16.5
-
-
Bank of Baroda
Neutral
160
-
36,867
19,980
23,178
1.8
1.8
11.5
17.3
13.9
9.3
1.6
1.3
8.3
10.1
-
-
Canara Bank
Neutral
268
-
14,525
15,225
16,836
1.8
1.8
14.5
28.0
18.5
9.6
1.3
1.0
5.8
8.5
-
-
Dewan Housing Finance Neutral
265
-
7,734
2,225
2,688
2.9
2.9
29.7
34.6
8.9
7.7
1.4
1.2
16.1
16.8
-
-
Equitas Holdings
Buy
185
235
6,206
939
1,281
11.7
11.5
5.8
8.2
31.9
22.6
2.8
2.5
10.9
11.5
-
-
Federal Bank
Neutral
67
-
11,426
9,353
10,623
2.9
2.9
4.4
5.8
15.1
11.5
1.5
1.3
9.5
11.0
-
-
HDFC
Neutral
1,378
-
217,817
11,475
13,450
3.4
3.4
45.3
52.5
30.4
26.2
5.9
5.2
20.2
20.5
-
-
HDFC Bank
Accumulate
1,249
1,350
316,176
46,097
55,433
4.5
4.5
58.4
68.0
21.4
18.4
3.8
3.1
18.8
18.6
-
-
ICICI Bank
Neutral
252
-
146,674
39,029
45,903
3.3
3.3
16.7
16.3
15.1
15.5
1.9
1.7
10.1
12.4
-
-
LIC Housing Finance
Neutral
550
-
27,777
3,712
4,293
2.6
2.5
39.0
46.0
14.1
12.0
2.7
2.3
19.9
20.1
-
-
Punjab Natl.Bank
Neutral
128
-
25,056
23,532
23,595
2.3
2.4
6.8
12.6
18.8
10.1
2.9
2.1
3.3
6.5
-
-
South Ind.Bank
Neutral
22
-
3,031
6,435
7,578
2.5
2.5
2.7
3.1
8.3
7.2
1.1
0.9
10.1
11.2
-
-
St Bk of India
Neutral
255
-
197,912
88,650
98,335
2.6
2.6
13.5
18.8
18.9
13.6
1.8
1.6
7.0
8.5
-
-
Union Bank
Neutral
134
-
9,195
13,450
14,925
2.3
2.3
25.5
34.5
5.3
3.9
0.8
0.7
7.5
10.2
-
-
Yes Bank
Neutral
1,343
-
56,553
8,978
11,281
3.3
3.4
74.0
90.0
18.2
14.9
3.4
2.9
17.0
17.2
-
-
FMCG
Asian Paints
Neutral
1,113
-
106,802
17,128
18,978
16.8
16.4
19.1
20.7
58.3
53.8
20.3
19.1
34.8
35.5
6.1
5.5
Britannia
Neutral
3,367
-
40,392
9,795
11,040
14.6
14.9
80.3
94.0
41.9
35.8
17.2
13.3
41.2
-
3.9
3.4
Colgate
Neutral
949
-
25,805
4,605
5,149
23.4
23.4
23.8
26.9
39.9
35.3
22.1
17.3
64.8
66.8
5.6
5.0
Dabur India
Neutral
296
-
52,018
8,315
9,405
19.8
20.7
8.1
9.2
36.5
32.1
10.2
8.4
31.6
31.0
6.0
5.3
GlaxoSmith Con*
Neutral
6,309
-
26,533
4,350
4,823
21.2
21.4
179.2
196.5
35.2
32.1
9.4
7.9
27.1
26.8
5.5
4.9
Godrej Consumer
Neutral
1,532
-
52,165
10,235
11,428
18.4
18.6
41.1
44.2
37.3
34.7
8.3
7.0
24.9
24.8
5.2
4.6
HUL
Neutral
930
-
201,199
35,252
38,495
17.6
17.4
20.4
21.9
45.5
42.5
37.4
32.8
82.2
77.3
5.4
4.9
ITC
Accumulate
254
283
306,659
40,059
44,439
39.0
39.2
9.1
10.1
27.9
25.2
7.6
6.7
27.2
26.5
7.1
6.4
Marico
Neutral
294
-
37,950
6,430
7,349
18.8
19.5
6.4
7.7
46.0
38.2
13.9
11.7
33.2
32.5
5.8
5.1
Nestle*
Neutral
6,797
-
65,530
10,073
11,807
20.7
21.5
124.8
154.2
54.5
44.1
22.4
20.1
34.8
36.7
6.2
5.3
Tata Global
Neutral
138
-
8,735
8,675
9,088
9.8
9.8
7.4
8.2
18.7
16.9
2.1
2.0
7.9
8.1
0.9
0.9
Procter & Gamble
Neutral
6,855
-
22,252
2,939
3,342
23.2
23.0
146.2
163.7
46.9
41.9
105.0
100.7
25.3
23.5
7.3
6.4
Hygiene
Stock Watch
August 23, 2016
Company Name
Reco
CMP
Target
Mkt Cap
Sales ( Čcr )
OPM(%)
EPS (Č)
PER(x)
P/BV(x)
RoE(%)
EV/Sales(x)
(Č)
Price ( Č)
( Č cr )
FY17E FY18E
FY17E
FY18E
FY17E
FY18E
FY17E
FY18E
FY17E
FY18E
FY17E
FY18E
FY17E
FY18E
IT
HCL Tech^
Buy
772
1,000
108,946
49,242
57,168
20.5
20.5
55.7
64.1
13.9
12.1
2.8
2.2
20.3
17.9
2.1
1.7
Infosys
Buy
1,015
1,370
233,232
69,934
79,025
27.5
27.5
64.8
72.0
15.7
14.1
3.5
3.1
22.0
22.3
2.8
2.4
TCS
Accumulate
2,551
3,004
502,745
121,684
136,286
27.3
27.3
135.0
150.1
18.9
17.0
6.3
5.8
33.2
33.9
4.0
3.6
Tech Mahindra
Buy
466
700
45,283
30,347
33,685
17.0
17.0
37.5
41.3
12.4
11.3
2.7
2.3
21.8
20.7
1.2
1.1
Wipro
Buy
515
680
127,316
51,631
55,822
21.7
17.9
35.9
36.9
14.4
14.0
3.0
2.8
19.0
18.1
2.2
2.0
Media
D B Corp
Neutral
406
-
7,452
2,297
2,590
27.4
28.2
21.0
23.4
19.3
17.3
4.5
3.9
23.7
23.1
3.0
2.6
HT Media
Neutral
78
-
1,812
2,693
2,991
12.6
12.9
7.9
9.0
9.9
8.7
0.8
0.8
7.8
8.3
0.3
0.1
Jagran Prakashan
Accumulate
184
205
6,004
2,355
2,635
28.0
28.0
9.9
10.8
18.6
17.0
3.7
3.2
21.7
21.7
2.6
2.3
Sun TV Network
Neutral
459
-
18,083
2,850
3,265
70.1
71.0
26.2
30.4
17.5
15.1
4.5
4.0
24.3
25.6
6.3
5.4
Hindustan Media
Neutral
267
-
1,961
1,016
1,138
24.3
25.2
27.3
30.1
9.8
8.9
1.9
1.7
16.2
15.8
1.3
1.1
Ventures
TV Today Network
Buy
298
363
1,776
637
743
27.5
27.5
18.4
21.4
16.2
13.9
2.8
2.4
17.4
17.2
2.4
2.0
Metals & Mining
Coal India
Neutral
335
-
211,693
84,638
94,297
21.4
22.3
24.5
27.1
13.7
12.4
5.7
5.4
42.6
46.0
2.0
1.8
Hind. Zinc
Neutral
230
-
96,992
14,252
18,465
55.9
48.3
15.8
21.5
14.5
10.7
2.4
2.1
17.0
20.7
6.8
5.2
Hindalco
Neutral
156
-
32,214
107,899
112,095
7.4
8.2
9.2
13.0
17.0
12.0
0.8
0.8
4.8
6.6
0.8
0.8
JSW Steel
Neutral
1,768
-
42,744
53,201
58,779
16.1
16.2
130.6
153.7
13.5
11.5
1.8
1.6
14.0
14.4
1.6
1.4
NMDC
Neutral
109
-
43,354
6,643
7,284
44.4
47.7
7.1
7.7
15.4
14.2
1.3
1.3
8.8
9.2
4.1
3.7
SAIL
Neutral
50
-
20,733
47,528
53,738
(0.7)
2.1
(1.9)
2.6
19.3
0.6
0.5
(1.6)
3.9
1.3
1.2
Vedanta
Neutral
177
-
52,357
71,744
81,944
19.2
21.7
13.4
20.1
13.2
8.8
1.1
1.0
8.4
11.3
1.1
0.8
Tata Steel
Neutral
387
-
37,630
121,374
121,856
7.2
8.4
18.6
34.3
20.8
11.3
1.3
1.2
6.1
10.1
0.9
0.9
Oil & Gas
Cairn India
Neutral
206
-
38,669
9,127
10,632
4.3
20.6
8.8
11.7
23.4
17.6
0.8
0.7
3.3
4.2
5.6
4.6
GAIL
Neutral
364
-
46,179
56,220
65,198
9.3
10.1
27.1
33.3
13.4
10.9
1.2
1.1
9.3
10.7
1.0
0.9
ONGC
Neutral
239
-
204,776
137,222
152,563
15.0
21.8
19.5
24.1
12.3
9.9
1.1
1.0
8.5
10.1
1.8
1.6
Petronet LNG
Neutral
332
-
24,930
-
0
-
-
-
-
-
-
Indian Oil Corp
Neutral
560
-
135,917
373,359
428,656
5.9
5.5
54.0
59.3
10.4
9.4
1.6
1.4
16.0
15.6
0.5
0.4
Reliance Industries
Neutral
1,014
-
328,752
301,963
358,039
12.1
12.6
87.7
101.7
11.6
10.0
1.2
1.1
10.7
11.3
1.6
1.3
Pharmaceuticals
Alembic Pharma
Neutral
643
-
12,112
3,483
4,083
20.2
21.4
24.3
30.4
26.4
21.1
6.0
4.8
25.5
25.3
3.4
2.8
Aurobindo Pharma
Buy
750
877
43,894
15,720
18,078
23.7
23.7
41.4
47.3
18.1
15.9
4.7
3.7
29.6
26.1
3.0
2.6
Aventis*
Neutral
4,330
-
9,972
2,357
2,692
17.3
17.3
153.5
169.2
28.2
25.6
4.8
3.9
25.8
28.4
3.9
3.2
Cadila Healthcare
Accumulate
369
400
37,797
11,126
13,148
22.0
22.0
17.1
20.0
21.6
18.5
5.5
4.4
28.8
26.6
3.4
2.8
Stock Watch
August 23, 2016
Company Name
Reco
CMP
Target
Mkt Cap
Sales ( Čcr )
OPM(%)
EPS (Č)
PER(x)
P/BV(x)
RoE(%)
EV/Sales(x)
(Č)
Price ( Č)
( Č cr )
FY17E FY18E
FY17E
FY18E
FY17E
FY18E
FY17E
FY18E
FY17E
FY18E
FY17E
FY18E
FY17E
FY18E
Pharmaceuticals
Cipla
Reduce
557
490
44,795
15,378
18,089
17.4
18.4
21.6
27.2
25.8
20.5
3.3
2.9
13.7
15.2
3.1
2.6
Dr Reddy's
Neutral
3,014
-
51,396
16,043
18,119
23.1
24.7
126.0
157.8
23.9
19.1
3.5
3.1
15.7
17.1
3.2
2.8
Dishman Pharma
Sell
178
45
2,868
1,718
1,890
22.7
22.8
9.5
11.3
18.7
15.7
1.8
1.6
10.1
10.9
2.1
1.8
GSK Pharma*
Neutral
3,073
-
26,031
3,528
3,811
16.6
18.8
51.8
59.4
59.3
51.7
15.9
15.8
26.3
30.6
7.3
6.8
Indoco Remedies
Sell
300
225
2,762
1,112
1,289
18.2
18.2
13.2
15.6
22.7
19.2
4.0
3.4
19.2
19.2
2.6
2.3
Ipca labs
Buy
511
613
6,445
3,303
3,799
15.3
15.3
17.3
19.7
29.5
25.9
2.6
2.4
9.1
9.4
2.1
1.8
Lupin
Accumulate
1,545
1,809
69,664
15,912
18,644
26.4
26.7
58.1
69.3
26.6
22.3
5.2
4.2
21.4
20.9
4.6
3.8
Sun Pharma
Buy
770
944
185,303
31,129
35,258
30.0
30.9
28.0
32.8
27.5
23.5
4.2
3.5
18.7
18.9
5.7
4.8
Power
Tata Power
Neutral
77
-
20,839
36,916
39,557
17.4
27.1
5.1
6.3
15.1
12.2
1.3
1.2
9.0
10.3
1.6
1.4
NTPC
Neutral
164
-
134,855
86,605
95,545
17.5
20.8
11.8
13.4
13.9
12.2
1.4
1.3
10.5
11.1
2.9
2.9
Power Grid
Neutral
181
-
94,849
25,763
29,762
74.3
73.1
14.8
17.3
12.3
10.5
1.9
1.7
16.9
17.5
8.0
7.6
Real Estate
MLIFE
Buy
432
554
1,774
925
1,139
18.4
22.3
18.3
33.8
23.6
12.8
1.1
1.1
4.9
8.5
2.6
2.1
Telecom
Bharti Airtel
Neutral
350
-
139,989
105,086
114,808
34.5
34.7
12.2
16.4
28.7
21.4
1.9
1.8
6.8
8.4
2.3
2.0
Idea Cellular
Neutral
94
-
34,010
40,133
43,731
37.2
37.1
6.4
6.5
14.8
14.5
1.2
1.1
8.2
7.6
1.9
1.6
zOthers
Abbott India
Neutral
4,644
-
9,869
3,153
3,583
14.1
14.4
152.2
182.7
30.5
25.4
149.8
127.9
25.6
26.1
2.9
2.5
Bajaj Electricals
Accumulate
262
277
2,642
5,099
5,805
5.7
5.9
11.4
14.6
23.0
17.9
3.1
2.7
13.4
15.1
0.5
0.4
Finolex Cables
Neutral
434
-
6,636
2,883
3,115
12.0
12.1
14.2
18.6
30.6
23.3
16.3
14.2
15.8
14.6
2.0
1.8
Goodyear India*
Buy
556
631
1,281
1,598
1,704
10.4
10.2
49.4
52.6
11.3
10.6
51.9
45.5
18.2
17.0
0.5
62.3
Hitachi
Neutral
1,479
-
4,022
2,081
2,433
8.8
8.9
33.4
39.9
44.3
37.1
35.7
29.8
22.1
21.4
1.8
1.5
Jyothy Laboratories
Neutral
286
-
5,172
1,440
2,052
11.5
13.0
8.5
10.0
33.6
28.6
8.1
7.5
18.6
19.3
3.9
2.7
MRF
Buy
35,489
45,575
15,051
-
0
-
-
-
-
-
-
Page Industries
Neutral
14,283
-
15,931
2,450
3,124
20.1
17.6
299.0
310.0
47.8
46.1
318.1
242.8
47.1
87.5
6.5
5.1
Relaxo Footwears
Neutral
467
-
5,606
2,085
2,469
9.2
8.2
7.6
8.0
61.8
58.8
24.0
20.4
17.9
18.8
2.8
2.4
Siyaram Silk Mills
Buy
1,195
1,347
1,120
1,799
2,040
11.6
11.7
104.9
122.4
11.4
9.8
1.9
1.6
16.4
16.4
0.8
0.7
Styrolution ABS India*
Neutral
575
-
1,011
1,440
1,537
9.2
9.0
40.6
42.6
14.2
13.5
36.2
32.9
12.3
11.6
0.6
0.6
TVS Srichakra
Buy
2,503
2,932
1,916
2,304
2,614
13.7
13.8
231.1
266.6
10.8
9.4
281.2
221.4
33.9
29.3
0.8
0.7
HSIL
Neutral
355
-
2,568
2,384
2,515
15.8
16.3
15.3
19.4
23.2
18.3
23.1
19.9
7.8
9.3
1.2
1.1
Kirloskar Engines India
Neutral
285
-
4,119
2,554
2,800
9.9
10.0
10.5
12.1
27.1
23.5
11.4
10.7
10.7
11.7
1.3
1.1
Ltd
M M Forgings
Neutral
428
-
517
546
608
20.4
20.7
41.3
48.7
10.4
8.8
58.7
51.9
16.6
17.0
0.8
0.7
Stock Watch
August 23, 2016
Company Name
Reco
CMP
Target
Mkt Cap
Sales ( Čcr )
OPM(%)
EPS (Č)
PER(x)
P/BV(x)
RoE(%)
EV/Sales(x)
(Č)
Price ( Č)
( Č cr )
FY17E
FY18E
FY17E
FY18E
FY17E
FY18E
FY17E
FY18E
FY17E
FY18E
FY17E
FY18E
FY17E
FY18E
zOthers
Banco Products (India) Neutral
213
-
1,521
1,353
1,471
12.3
12.4
14.5
16.3
14.7
13.1
20.3
18.3
14.5
14.6
1.1
117.4
Competent Automobiles Neutral
171
-
105
1,137
1,256
3.1
2.7
28.0
23.6
6.1
7.2
32.8
29.7
14.3
11.5
0.1
0.1
Nilkamal
Neutral
1,228
-
1,833
1,995
2,165
10.7
10.4
69.8
80.6
17.6
15.2
70.2
61.0
16.6
16.5
0.9
0.8
Visaka Industries
Neutral
161
-
256
1,051
1,138
10.3
10.4
21.0
23.1
7.7
7.0
20.7
19.4
9.0
9.2
0.5
0.5
Transport Corporation of
Neutral
358
-
2,740
2,671
2,911
8.5
8.8
13.9
15.7
25.8
22.9
3.5
3.2
13.7
13.8
1.1
1.0
India
Elecon Engineering
Accumulate
56
63
614
1,482
1,660
13.7
14.5
3.9
5.8
14.5
9.7
3.4
3.1
7.8
10.9
0.7
0.7
Surya Roshni
Buy
175
201
766
3,342
3,625
7.8
7.5
17.3
19.8
10.1
8.8
19.2
15.4
10.5
10.8
0.5
0.4
MT Educare
Neutral
140
-
559
366
417
17.7
18.2
9.4
10.8
15.0
13.0
3.3
2.9
22.2
22.3
1.3
1.1
Radico Khaitan
Buy
98
125
1,310
1,659
1,802
13.0
13.2
6.3
7.4
15.5
13.4
1.3
1.2
8.6
9.3
1.3
1.1
Garware Wall Ropes
Neutral
507
-
1,109
873
938
12.9
13.1
30.9
34.9
16.4
14.5
2.6
2.2
15.7
15.2
1.2
1.1
Wonderla Holidays
Neutral
415
-
2,342
287
355
38.0
40.0
11.3
14.2
36.7
29.2
5.3
4.6
21.4
23.9
7.6
6.1
Linc Pen & Plastics
Accumulate
260
283
384
382
420
9.3
9.5
13.5
15.7
19.3
16.6
3.3
2.9
17.1
17.3
1.1
1.0
The Byke Hospitality
Neutral
160
-
642
287
384
20.5
20.5
7.6
10.7
21.1
15.0
4.4
3.6
20.7
23.5
2.3
1.7
Interglobe Aviation
Neutral
902
-
32,501
21,122
26,005
14.5
27.6
110.7
132.1
8.2
6.8
48.8
34.8
168.5
201.1
1.5
1.2
Coffee Day Enterprises
Neutral
237
-
4,883
2,964
3,260
20.5
21.2
4.7
8.0
-
29.6
2.7
2.5
5.5
8.5
2.1
1.9
Ltd
Navneet Education
Neutral
104
-
2,471
1,062
1,147
24.0
24.0
6.1
6.6
17.0
15.7
3.5
3.1
20.6
19.8
2.3
2.2
Navkar Corporation
Buy
201
265
2,864
408
612
42.9
42.3
6.8
11.5
29.7
17.5
2.1
1.8
6.9
10.5
7.7
5.2
UFO Moviez
Neutral
467
-
1,289
619
685
33.2
33.4
30.0
34.9
15.6
13.4
2.2
1.9
13.8
13.9
2.0
1.6
VRL Logistics
Neutral
295
-
2,691
1,902
2,119
16.7
16.6
14.6
16.8
20.3
17.5
4.4
3.9
21.9
22.2
1.6
1.4
Team Lease Serv.
Neutral
1,059
-
1,810
3,229
4,001
1.5
1.8
22.8
32.8
46.5
32.2
5.0
4.3
10.7
13.4
0.5
0.4
S H Kelkar & Co.
Neutral
298
-
4,307
1,036
1,160
15.1
15.0
6.1
7.2
48.8
41.5
5.2
4.8
10.7
11.5
3.9
3.5
Quick Heal
Neutral
241
-
1,690
408
495
27.3
27.0
7.7
8.8
31.2
27.5
2.9
2.9
9.3
10.6
3.3
2.7
Narayana Hrudaya
Neutral
314
-
6,422
1,873
2,166
11.5
11.7
2.6
4.0
118.8
79.3
7.3
6.6
6.1
8.3
3.4
2.9
Manpasand Bever.
Neutral
731
-
3,661
836
1,087
19.6
19.4
16.9
23.8
43.3
30.7
5.2
4.5
12.0
14.8
4.1
3.0
Parag Milk Foods
Neutral
316
-
2,660
1,919
2,231
9.3
9.6
9.5
12.9
33.5
24.5
5.2
4.3
15.5
17.5
1.5
1.3
Source: Company, Angel Research; Note: *December year end; #September year end; &October year end; Price as on August 22, 2016
Market Outlook
August 23, 2016
Research Team Tel: 022 - 39357800
DISCLAIMER
Angel Broking Private Limited (hereinafter referred to as “Angel”) is a registered Member of National Stock Exchange of India
Limited,Bombay Stock Exchange Limited and Metropolitan Stock Exchange Limited. It is also registered as a Depository Participant with
CDSL and Portfolio Manager with SEBI. It also has registration with AMFI as a Mutual Fund Distributor. Angel Broking Private Limited is a
registered entity with SEBI for Research Analyst in terms of SEBI (Research Analyst) Regulations, 2014 vide registration number
INH000000164. Angel or its associates has not been debarred/ suspended by SEBI or any other regulatory authority for accessing
/dealing in securities Market. Angel or its associates/analyst has not received any compensation / managed or
co-managed public offering of securities of the company covered by Analyst during the past twelve months.
This document is solely for the personal information of the recipient, and must not be singularly used as the basis of any investment
decision. Nothing in this document should be construed as investment or financial advice. Each recipient of this document should make
such investigations as they deem necessary to arrive at an independent evaluation of an investment in the securities of the companies
referred to in this document (including the merits and risks involved), and should consult their own advisors to determine the merits and
risks of such an investment.
Reports based on technical and derivative analysis center on studying charts of a stock's price movement, outstanding positions and
trading volume, as opposed to focusing on a company's fundamentals and, as such, may not match with a report on a company's
fundamentals. Investors are advised to refer the Fundamental and Technical Research Reports available on our website to evaluate the
contrary view, if any.
The information in this document has been printed on the basis of publicly available information, internal data and other reliable
sources believed to be true, but we do not represent that it is accurate or complete and it should not be relied on as such, as this
document is for general guidance only. Angel Broking Pvt. Limited or any of its affiliates/ group companies shall not be in any way
responsible for any loss or damage that may arise to any person from any inadvertent error in the information contained in this report.
Angel Broking Pvt. Limited has not independently verified all the information contained within this document. Accordingly, we cannot
testify, nor make any representation or warranty, express or implied, to the accuracy, contents or data contained within this document.
While Angel Broking Pvt. Limited endeavors to update on a reasonable basis the information discussed in this material, there may be
regulatory, compliance, or other reasons that prevent us from doing so.
This document is being supplied to you solely for your information, and its contents, information or data may not be reproduced,
redistributed or passed on, directly or indirectly.
Neither Angel Broking Pvt. Limited, nor its directors, employees or affiliates shall be liable for any loss or damage that may arise from
or in connection with the use of this information.